
Hexana mascot
Binary Development Environment

See What Your Compiler Actually Built

Hexana is a Binary Development Environment for IntelliJ IDEA and VS Code. Inspect and verify compiled binaries — WASM, native executables (ELF, Mach-O, PE/COFF), and JIT output — across aarch64, x86_64, and RISC-V, without leaving your IDE.

✦ Book a demo30 min live walkthrough with the team
$ ext install JetBrains.hexana-wasm
Works in IntelliJ IDEA · CLion · WebStorm · PyCharm · Rider · VS Code
WAT
(module
  (type $t0 (func (param i32 i32) (result i32)))
  (import "env" "memory" (memory 1))
  (func $add (type $t0)
    local.get 0
    local.get 1
    i32.add)
  (export "add" (func $add))

Hexana renders every function in your .wasm as structured WAT — 14k functions, virtualized.

Your build pipeline ends at the binary. Your visibility shouldn't.

The gap

Source tools stop at source.

Compilers, optimizers, and linkers transform code in ways no source-level linter can see. Inlining, dead-code elimination, name stripping, and cross-module merging all happen below the source layer. By the time your artifact ships, the source view and the binary view disagree.
The cost

Bugs and vulnerabilities live in the artifact.

A library your build.gradle declares might have been eliminated by the JIT. A CVE your manifest scanner flags might not survive dead-code elimination in your GraalVM native image. The artifact knows what shipped; the manifest only knows what you asked for.

The fix

Hexana reads the binary, not the build graph.

Structured extraction — not explanation, not decompilation — from the artifact you actually ship. WASM sections, native symbols, JIT-compiled machine code, and embedded SBOMs, all surfaced inside the IDE you already use.

01
WebAssembly Analysis

Structured WAT and WIT views

Every section of your .wasm file — type, import, export, code, data, custom — rendered as navigable, foldable WAT text. WIT component interfaces parsed and highlighted. Virtualized rendering handles 14k+ function modules without freezing the editor.

02
WASM Module Diff

Compare two .wasm builds

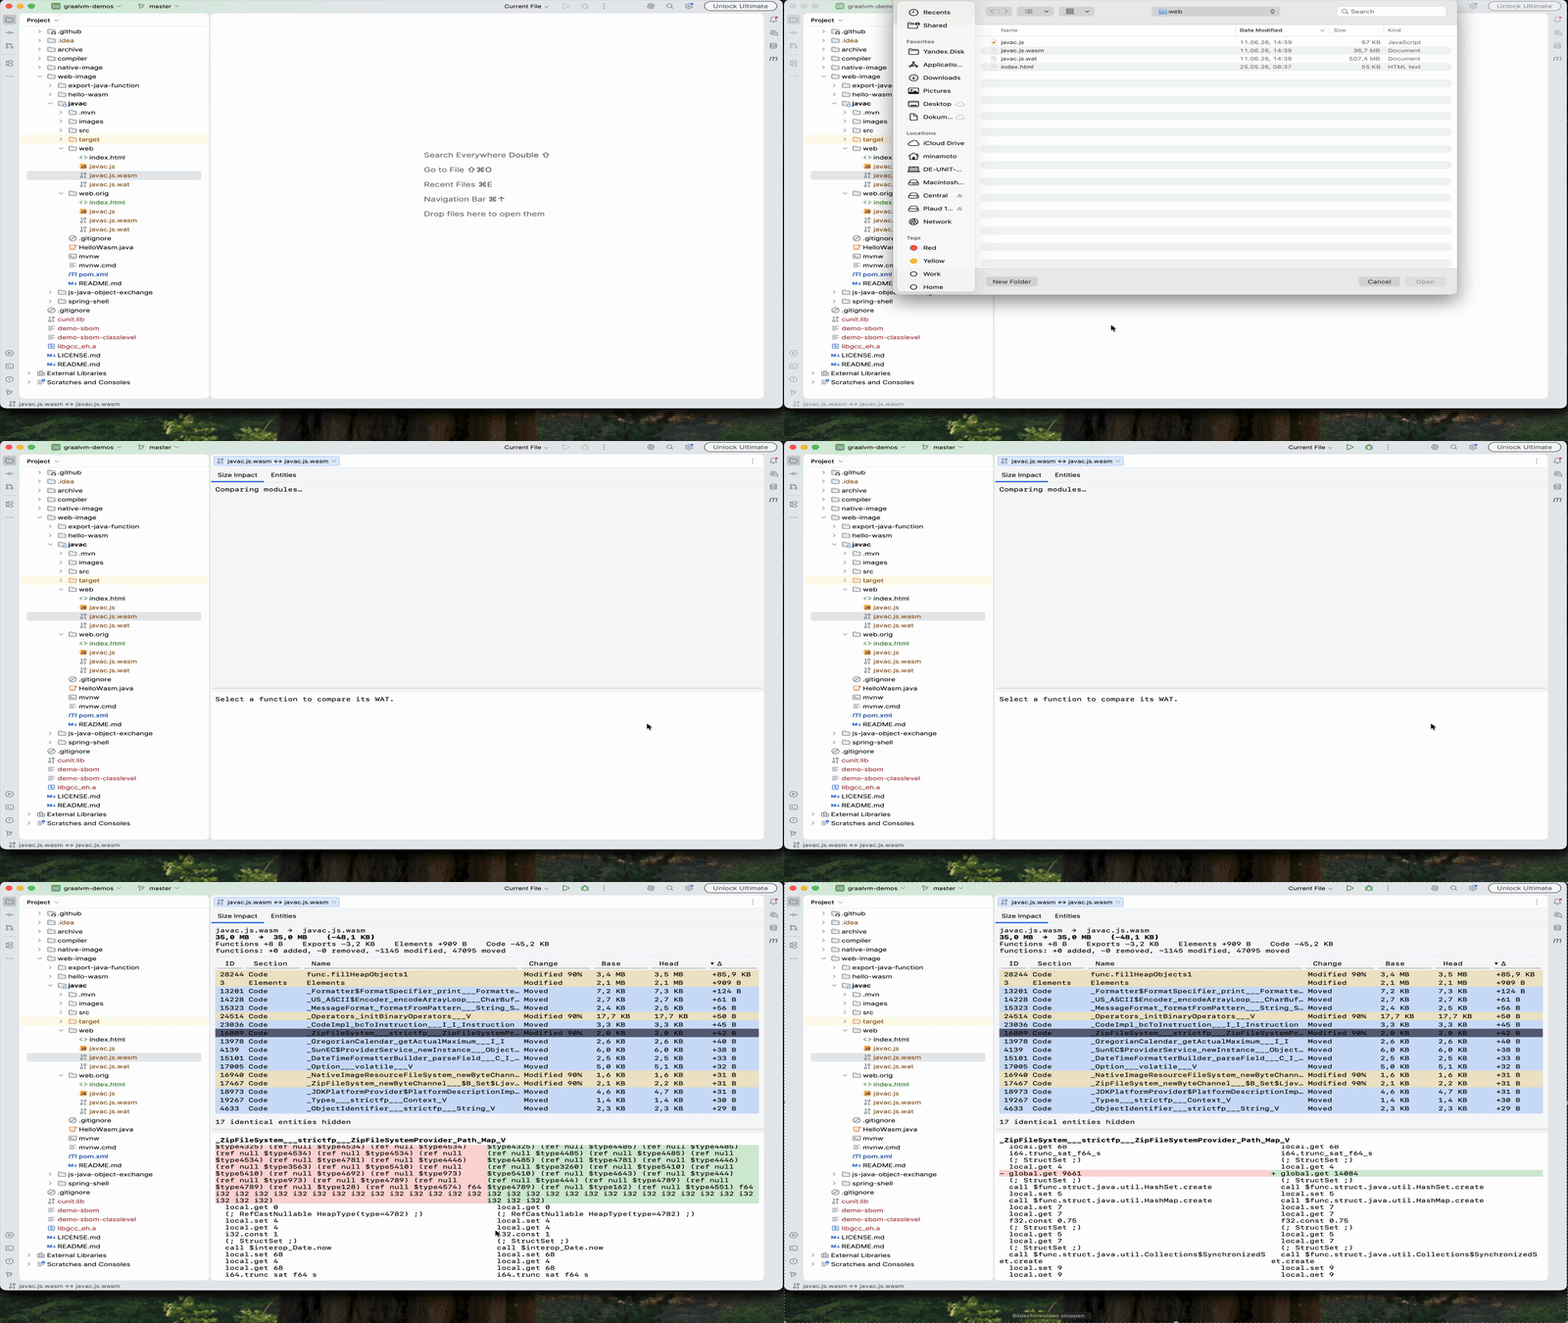
“Compare WASM With…” produces a Size Impact tab, an Entities tab (added / removed / modified / moved), and a symbolic WAT side-by-side. Function matching uses a content hash over renormalized opcodes plus call-graph propagation, so renaming and reordering don't cause false positives.

03
JVM JIT Viewer

Capture what HotSpot compiled

A bundled JVMTI agent writes a .jit file as your JVM runs. Hexana opens it with Combined, Bytecode, and Machine-Code tabs. JMH fork instrumentation is built in.

in:computeHash
04
Native Binary Support

ELF, Mach-O, PE/COFF disassembly

Symbol tables, Capstone-powered per-function disassembly (x86_64 and AArch64), DWARF source navigation, and a strings scanner. Fat Mach-O slices and .a/.lib static-library member enumeration. GraalVM Web Image binaries get a “Java” badge with jump-to-bytecode navigation.

05
GraalVM Native Image SBOM

Verify what native-image kept

Binaries built with --enable-sbom embed a CycloneDX bill of materials. Hexana renders it in a sortable table and cross-references components against the OSV database — offline by default. With --enable-sbom=class-level, Hexana distinguishes “vulnerable class retained” from “eliminated by DCE.”

06
MCP Tools for AI Agents

Binary context for your AI assistant

A bundled MCP server exposes functions, imports, exports, data segments, and SBOM data to any MCP-compatible agent (Claude, Copilot, Cursor). query_artifacts consolidates module info into a single structured call.

I

Open any binary

Open a .wasm, .so, .dylib, .exe, .a, or .jit file in IntelliJ IDEA or VS Code. Hexana detects the format automatically and routes it to the right view.

II

Navigate the structure

Use the tabbed panel — WAT, Size, Imports/Exports, Disassembly, SBOM — to inspect what the binary contains. Click a function to jump to its WAT; click a CVE to see whether the vulnerable class survived dead-code elimination.

III

Diff, debug, or capture

Run “Compare WASM With…” to diff two builds. Step through a .wasm module against Node.js or Chrome (CDP) in-IDE. Run your JVM with the Hexana run configuration to capture a .jit trace.

✦ ✦ ✦
Hexana inside IntelliJ IDEA — opening a .wasm file and navigating the structured WAT view
IntelliJ IDEA

JetBrains Marketplace

Works in IntelliJ IDEA 2025.2+, CLion, WebStorm, PyCharm, RustRover, Rider.

Command palette
# VS Code command palette
ext install JetBrains.hexana-wasm

What Hexana Does Not Do

§Hexana is not a decompiler. It renders binary structure as structured text (WAT, symbol tables, disassembly); it does not reconstruct source code.
§SBOM vulnerability matching is class-level at best without enriched method-level advisory metadata. Hexana cannot prove a vulnerable code path is reachable from an entry point without that data.
§SBOM and vulnerability reachability are currently IntelliJ-only features.
§GraalVM JIT capture requires libgraal mode (the default). Capturing full inline records additionally requires -XX:+DebugNonSafepoints on the target JVM.
§Minimum supported IDE: IntelliJ IDEA 2025.2+ (build 252; and the same-version JetBrains IDEs: CLion, WebStorm, PyCharm, RustRover, Rider).

Working on compiled code — WASM, native binaries, or JIT output?

Request a format, share a workflow, or flag a problem we should detect.

What's this about? (optional)